
This article summarizes the basic transaction-related data and trackable metrics of your RUSH-powered solutions.
From this module, you can:
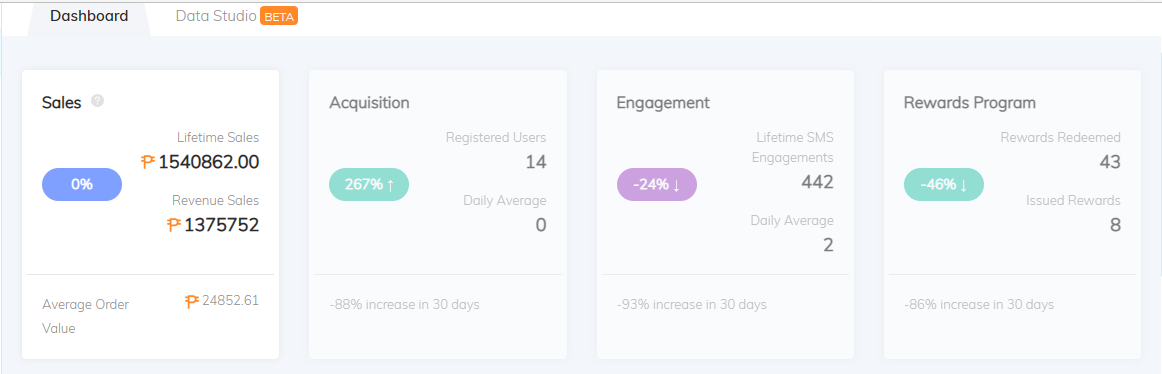
- Check the number of registrations and current users.
- Engagement metrics.
The following below are only applicable for accounts who have a rewards system.
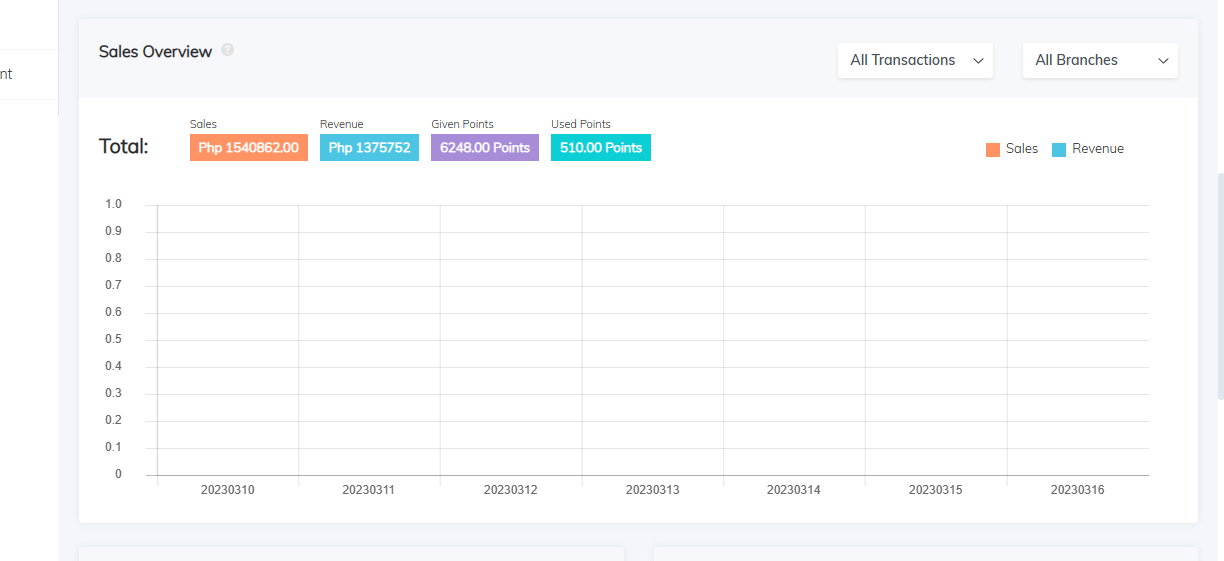
- Lifetime and revenue sales.
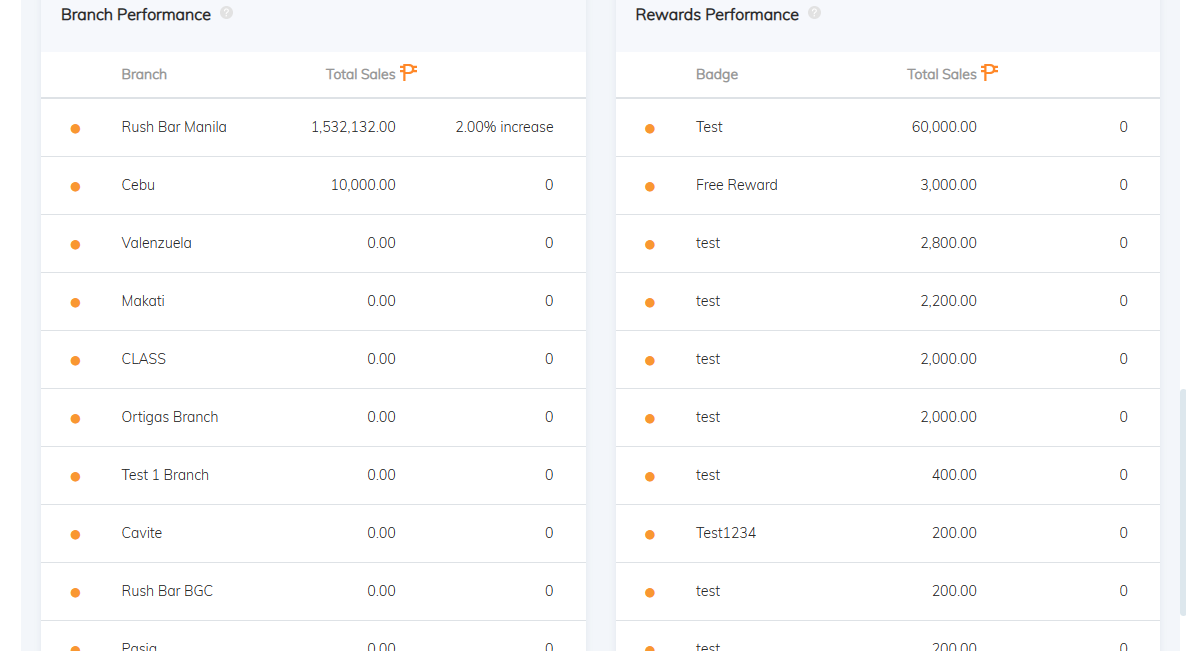
- Monitor your top branches and rewards.
- See all the transactions where your customers earn and burn points.
Note: Please note that this information is for reference purposes only. The data provided is a test sample and should not be considered as actual data.
Data Studio Qualification for Estore:
To qualify for the analytics dashboard subscription for an e-store, you must have completed at least 1 successful transaction by February 2023. A successful transaction is defined as one that was completed without any issues or complications, such as cancellations. It means the transaction must be tagged as delivered to qualify.
The qualification requirement ensures that you have transaction data to generate meaningful insights through the analytics data studio. By meeting this requirement, you can access valuable metrics and reports.
- Transaction Summary
This will display the summary of transactions such as below:- Successfully Delivered Order
- Average Delivered Basket Size
- Worth of Discounts
- Overall Sales
- Voucher Summary
- Provides an overview of the count and percentage of orders with or without a voucher. It also displays the count and percentage of the used voucher by code. This page is useful in determining the effectiveness of your voucher campaigns and allows you to make informed decisions on future voucher promotions. Additionally, you can check the stats of all your created vouchers by code, whether they were used or not.
- Order Details Summary:
- Shows the count and percentage of the different modes of deliveries and payments. This information helps you understand how your customers prefer to receive their orders and how they prefer to pay for them. The page also includes a graph representation of the mode of payment and delivery, which provides a visual representation of the data. This can help you identify patterns and make informed decisions about how to optimize your operations.
- RUSH Logistics Usage:
- Shows the count and percentage of RUSH platform deliveries versus bookings made outside the platform. It also allows you to check the total distance accumulated with your usage of RUSH Platform Delivery. A month-on-month graphical representation that shows the count and trend of RUSH delivery platform usage is also available. This page provides valuable insights into the performance of your logistics operations and helps you make data-driven decisions. A table containing all of your branches and total distance covered using RUSH Platform Delivery by brand.
- Customer Summary
- Shows the count and percentage of how customers created their accounts. This information can help you understand where your customers are coming from and how to better target your marketing efforts. Additionally, the page shows the count of the customer's gender and the number of registered customers born in a particular month. Graph stats list of unsuccessful and successful orders are also available on this page, allowing you to identify potential areas of improvement.
- Branch Summary
- Displays a table containing a summary of the transaction details per branch. This information is helpful in identifying which branches are performing well and which ones may need improvement. It can also help you allocate resources more effectively and optimize your operations.
- Product Summary
- Shows a table containing a summary of the transaction details per SKU. This information can help you identify which products are popular and which ones may need more attention. By understanding which products are performing well, you can optimize your inventory and make informed decisions on how to allocate resources.
- Customizable Transaction
- A blank page where you can filter out the transaction you want to check within the chosen date range. If you want to see specific details of your transactions, you can customize the filters and see data graphs and charts on this page. This page allows you to gain deeper insights into your transactions and identify areas for improvement. By customizing the filters, you can focus on the data that is most relevant to your business.